We compiled a list of questions you may have that go beyond the details provided above. If you do not find your answer in the this FAQ, please get in contact with us via twitter (@ultraconserved).
- Why call them UCEs?
- Why call them UCEs and not HCNCEs?
- What organisms have UCEs?
- Are UCEs only good for "deep" phylogenetic questions?
- Are any exons UCEs?
- Why not capture and sequence exons?
- The in-silico UCE capture studies are tortured, why not do something more simple and/or powerful?
- Why not just sequence many organismal genomes?
- Why use in-solution sequence capture probes like Agilent’s SureSelect™ or MYcroarray’s MYselect/MYbaits probes?
- Which is better, Sureselect™ or MYselect/MYbaits?
- Can you use NimbleGen probes or probes synthesized individually (e.g., from IDT)?
- Why use Illumina sequencing?
- Is HiSeq or MiSeq better for UCE captures?
- Can 454 be used for sequencing UCE loci?
- Can Ion Torrent be used for UCE captures?
Why call them UCEs?
We use the term "UCE" because that is the original term used by Bejerano et al. (2004) to describe their surprising discovery of extremely conserved elements shared among genomes that have diverged for tens of millions to hundreds of millions of years (i.e., human to rat, mouse, dog, and chicken — those were the amniote genome sequences available in 2004). It is relatively clear, though not exactly specified, that Bejerano et al. (2004) define UCEs as including elements of length X and similarity Y from genome set(Z). X, Y, and set(Z) are somewhat arbitrary designations, outside of the criterion that the regions be highly conserved, and different reseachers can use and have used different values for each of these parameters. Changing one or several of these parameters doesn’t create something new.
Several authors have taken the position that ultraconserved elements are a subset of "highly conserved elements", but that seems a rather narrow reading of the Bejerano et al. manuscript, let alone the subsequent Siepel et al. (2005) manuscript. Other authors are also introducing new names for very similar genomic regions (e.g., Reneker et al. 2012) or regions and techniques for capturing subsets of highly conserved loci (e.g., Lemmon et al. 2012).
It may well be more logical to consider UCEs a subset of highly conserved elements, and there are surely catchier names and many interesting parameter combinations to explore. However, we prefer to follow zoological naming convention and apply the terminology originally created for these genomic regions rather than define our own.
Why call them UCEs and not HCNCEs?
Although the vast majority of UCEs are non-coding, and thus Highly Conserved Non-Coding Elements (HCNCEs), some UCEs are exons. We generally aren’t doing anything to specifically exclude exons, so some exons are present in the UCE probe sets we have designed. Thus, they are not HCNCEs.
What organisms have UCEs?
Most work on UCEs has occurred in amniotes. However, UCEs are also well known in a variety of other organisms (Siepel et al. 2005, Stephen et al. 2008). We have also found UCEs in other taxa, and we're preparing those data and analyses for publication. Our general rule of thumb is to compare eukaryotic organisms that diverged between 100 and 300 million years ago in order to identify UCEs, and these values seem to work relatively well. However, it will not be surprising if the level of conservation varies over different timescales among different organismal groups.
It has been claimed that UCEs in plants are fundamentally different from those found in animals (Reneker et al. 2012), but these differences may be due to the higher divergence of plant species used for the identification of UCE loci, rather than a fundamental difference of the UCE loci identified.
Are UCEs only good for "deep" phylogenetic questions?
No. Although we've used UCEs to understand:
- very deep-time evolutionary relationships spanning hundreds of millions of years (McCormack et al. 2012, Faircloth et al. 2012, Crawford et al. 2012, McCormack et al. 2013, Faircloth et al. 2013)
We have also found that UCEs and their flanking regions will help us understand:
- shallow, population-level relationships spanning hundreds of thousands to millions of years (Smith et al. in review; Faircloth talk; Harvey talk; Alfaro talk)
- very shallow, individual-level (within-population) relationships spanning single-generations (Faircloth et al. 2012; Faircloth talk).
So, to say that data collected from UCE enrichments are only useful for deep-level studies is incorrect. We are actively working to produce additional studies using UCEs at the population/phylogeographic and individuals levels.
Are any exons UCEs?
Yes, some exons are UCEs. The number UCEs cotaining or overlapping exons depends on how you specifically define UCEs (i.e., length, percent similarity, and species aligned). In most of our work, we have found 5-10% of UCEs contain some portion of an exon.
Why not capture and sequence exons (exome capture)?
It is certainly possible, using exome capture, to collect sufficient data to estimate phylogenetic relationships between species or to study population-level or individual difference among species, particularly when the taxa being studied: (1) have sufficient genomic data to define what constitutes the "exome" and (2) are somewhat closely-related to one another (e.g., exons shared by primates).
However, the amount of available genome data remains lacking for many non-model taxa. Research programs like Genome 10k are working very hard to mitigate this shortfall, but the generation of genome and exome data and the subsequent annotatation of genome sequences is a laborious process. As a result, exome data are likely to remain limiting for many taxa for at least the next few years.
Additionally, exons tend to be conserved across narrower spans of the tree of life than UCEs - meaning it is unlikely exome capture will be efficient when applied across very divergent taxa - say, from humans to alligators. Consider the following figures that show the decay in the number of matches across probe sets designed from exons (Fig. 1a) and UCEs (Fig. 1b).
-
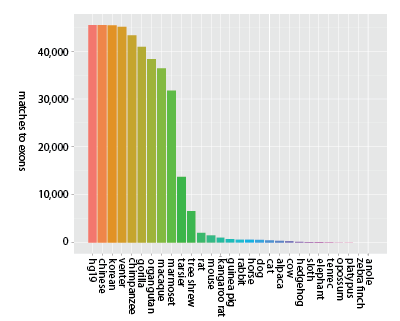
Figure 1a (click image for larger version).
Decay in the number of unique matches across genome sequences for sequence capture probes designed from exons (Coffey et al. 2011). Bars moving left to right show locus counts for groups of increasing degrees of taxonomic inclusiveness and the value on the x-axis shows the final member of the set: (hg19), (hg19, chinese), (hg19, chinese, korean), (hg19, chinese, korean, venter), etc. Thus, the final taxon on the x-axis (anole) represents the number of exon probes matching across all 29 taxa (hg19 to anole, inclusive) out of roughly 44,000 starting probes.
-
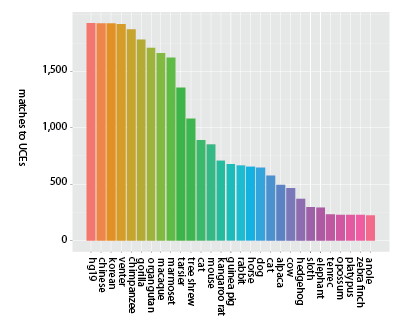
Figure 1b (click image for larger version).
Decay in the number of unique matches across genome sequences for sequence capture probes designed from UCEs (McCormack et al. 2012). Bars moving left to right show locus counts for groups of increasing degrees of taxonomic inclusiveness and the value on the x-axis shows the final member of the set: (hg19), (hg19, chinese), (hg19, chinese, korean), (hg19, chinese, korean, venter), etc. Thus, the final taxon on the x-axis (anole) represents the number of UCE probes matching across all 29 taxa (hg19 to anole, inclusive) out of roughly 2,500 starting probes.
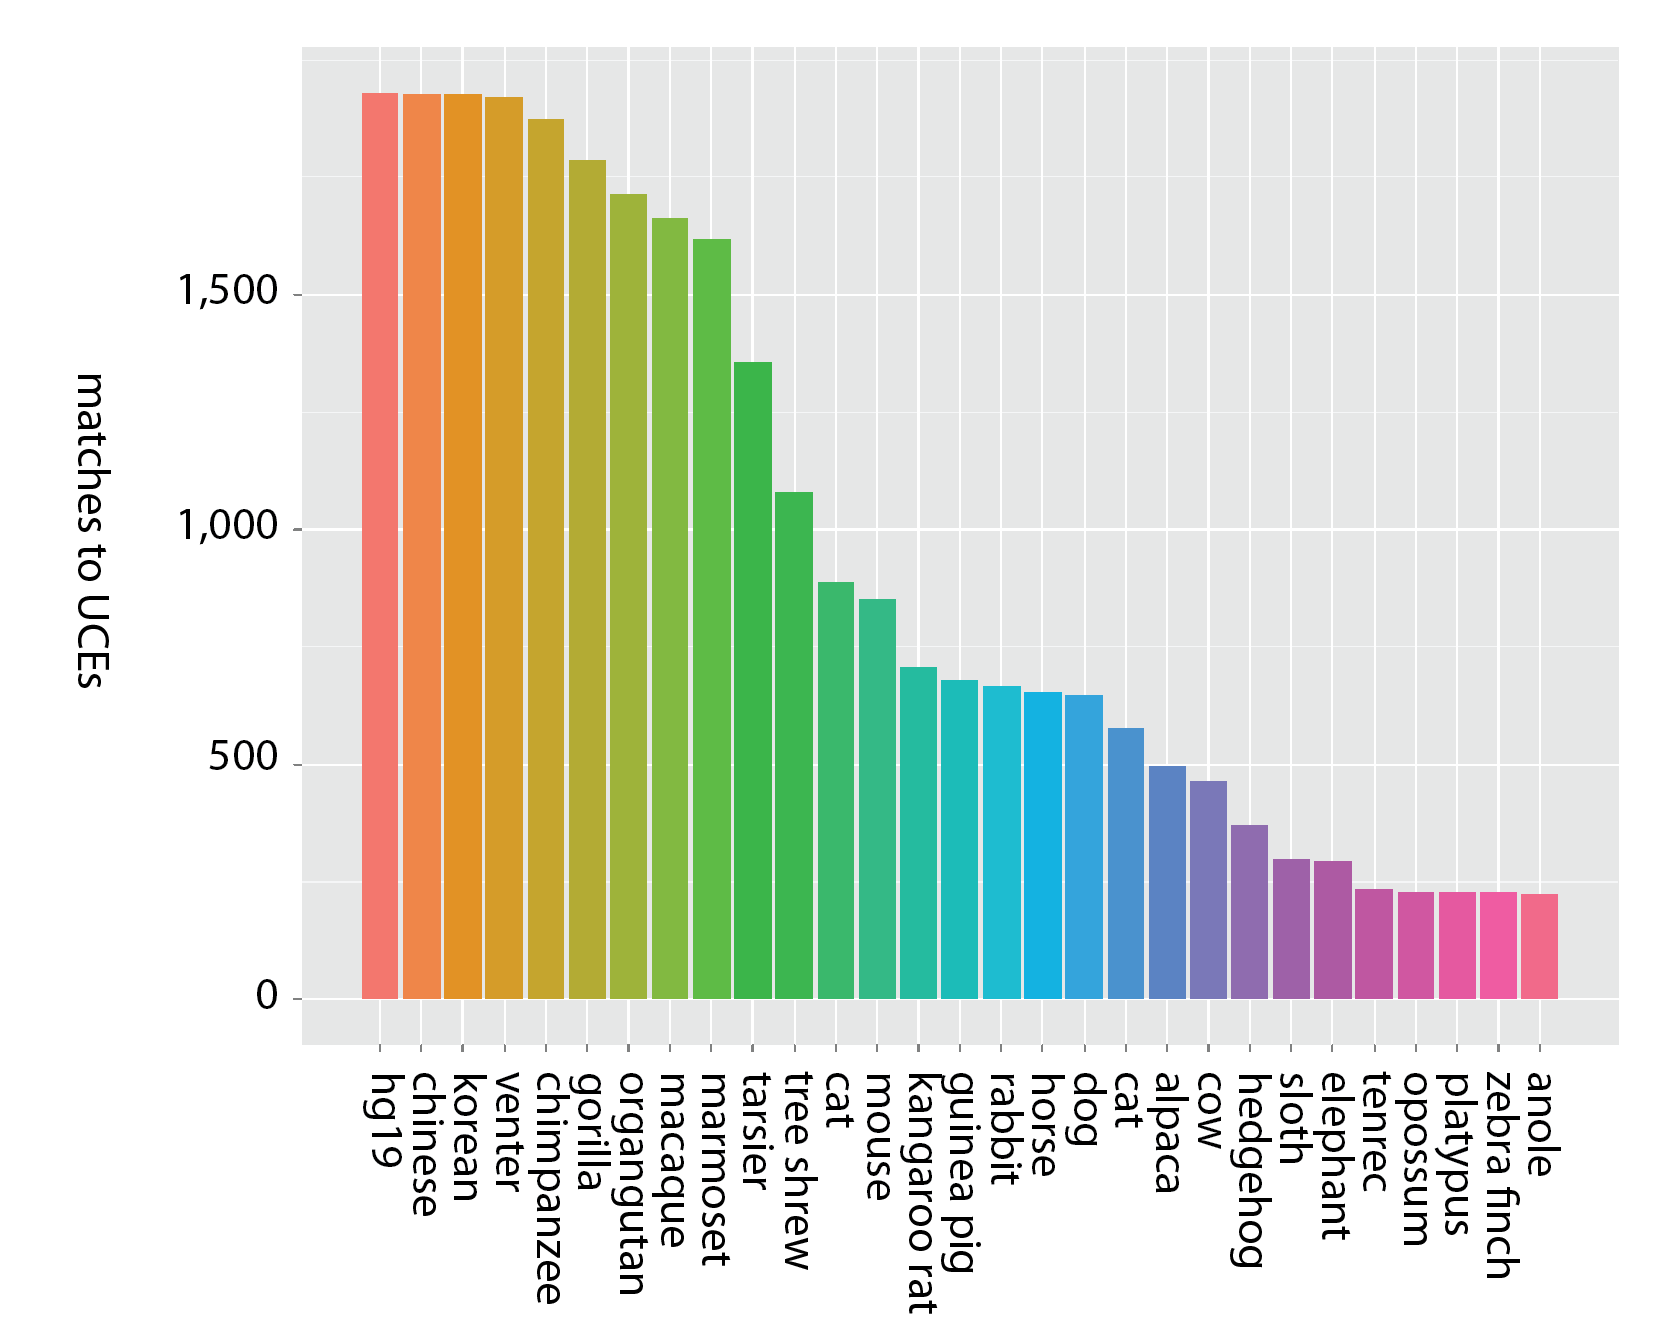
While the y-axis (number of probes matching) is different between the two panels, due to the different number of starting loci, the more important difference is the steepness of the decline in matched loci — matches to probes designed from exons decrease more rapidly as taxonomic inclusiveness of the group increases (moving left to right along the x-axis). Note that within primates, however, exon-derived probes [originally designed from the human exome (Coffey et al. 2011)] are found in high number across the available primate genome sequences.
The failure to detect probes designed from exons across broad taxonomic groups has several possible causes: 1) we used identical matching criteria to match both types of probes to genomes, and the strict probe-matching parameters used for UCEs may not work well for exons - primarily because variation in exons is distributed throughout their extent, as opposed to UCEs, which have a highly conserved core but variable flanks; 2) evolutionarily, exons may be more free to vary than UCEs; 3) exons may be affected by rearrangement more frequently than UCEs; and 4) genome builds of non-primate taxa may have poor coverage or assembly issues that prevent detection of particular exons.
The in-silico UCE capture studies are tortured, why not do something more simple and/or powerful?
We designed our in-silico analyses to give us guidance on what we should expect to obtain from subsequent in-vitro experiments. There is no doubt other methods would have been easier to implement, but at the time, we had very few points of reference other than a "best-guess".
Why not just sequence many organismal genomes?
Even though genomes are becoming much cheaper to sequence and assemble, our capture methods are still about 2 orders of magnitude less expensive to carry out, and the subsequent data analysis (while not simple) remains simpler than accurately assembling one or more genome sequences and aligning the genomes (or parts of the genomes). As a result, we expect capture-based genome reduction methods, specifically sequence capture of UCE loci, to prevail for several more years.
Why use in-solution sequence capture probes like Agilent’s SureSelect™ or MYcroarray’s MYselect/MYbaits probes?
In-solution probes have numerous advantages over doing captures on microarrays. This is why you see NimbleGen abandoning chips and moving entirely to in-solution capture probes - the market is drying up. SureSelect™ from Agilent was the first good, commercial, in-solution probe kit available. MYcroarray’s MYselect, now called MYbaits, is a very similar product but at a substantially lower cost. We used both of these options, initially, because they were the first available, consistent, and economical products. Now, we are working with additional vendors (IDT and NimbleGen, see below) on updated probe sets.
Which is better, Sureselect™ or MYselect/MYbaits?
We have ordered and used the exact same probes from both Agilent and MYcroarray and we have not seen any substantial differences in performance between the two systems.
Can you use NimbleGen probes or probes synthesized individually (e.g., ultramers from IDT)?
Absolutely. We are actively working with NimbleGen and IDT to assess some of our UCE probes designed using their systems. As you would expect, NimbleGen probes will be attractive when you want to survey the largest number of loci possible and IDT probes will be attractive when you have relatively few probes/loci of interest but very large numbers (1,000s) of samples to analyze.
Why use Illumina sequencing?
Throughput. Given the read length and the cost per megabase to produce data on the Illumina platform (see Glenn 2011 for a review), Illumina provides the most bang for the buck. We had originally designed all of our work to be done on the 454 platform. However, when the read lengths of Illumina exceeded 75 bases, it became obvious that it would be more efficient and cost effective to switch platforms. So, we stopped experiments well underway, retooled, waited for promised Illumina reagents (always a mistake), and once we received reagents, began again using the Illumina platform.
Is HiSeq or MiSeq better for UCE captures?
If your project is small (i.e., ≤ hundreds of loci; ≤ tens of individuals), if speed is of the essence, or if you want the longest possible contigs on Illumina (from PE150 reads — soon to be PE250), then the MiSeq is a reasonable option. If you want to get the largest number of loci and individuals at the lowest cost, then you should use the HiSeq. With the new rapid run mode for the HiSeq2500, you can get both increased read-lengths (PE150) and higher-throughput than the MiSeq.
Can 454 be used for sequencing UCE loci?
Yes. You will get longer contigs with fewer reads (a good thing). However, the cost per contig/locus and cost per sample are much higher and the number of loci per sample and total number of samples per run are much lower in comparison to using any Illumina instrument, especially the HiSeq.
Can Ion Torrent be used for UCE captures?
Yes. At present, Illumina beats Ion Torrent in nearly every performance category (Glenn 2011, Lohman 2012), but as the Proton becomes available and read lengths increase, this is likely to shift. We expect that the differences between Illumina and Ion Torrent will shrink considerably by late 2012 or early 2013, and the platform you select will be a matter of convenience and having data analysis pipelines available.